SingTel, Starhub, M1 APN Settings

SingTel

  • APN: e-ideas
    • Username: 65ideas
    • Password: 65ideas
  • APN: internet
    • Username: LEAVE_BLANK
    • Password: LEAVE_BLANK

Starhub

  • APN: shwapint
    • Username: LEAVE_BLANK
    • Password: LEAVE_BLANK
  • APN: shwap
    • Username: LEAVE_BLANK
    • Password: LEAVE_BLANK
    • Proxy: 10.12.1.2
    • Port: 80

M1

  • APN: sunsurf
    • Username: 65
    • Password: user123
  • APN: miworld
    • Username: 65
    • Password: user123

My toys

1. Analog Devices ADE7878 EVB


2.APM Wifi Module

3.EA BLDC Motor Control Board


4.EA LPC11D14 EVB


5.EA LPC314x EVB

6.EA LPC1343 Development Board

7.EA LPC1343 Quick Start Board

8.EA LPC1788 EVB

9.EA LPC3250 EVB

10.Embedded Artist LPC313x

11.Freescale iMX51 Android 2.3

12.Freescale Kinetis Tower System K40

13.Fujitsu 8bit MCU MB9xx EVB

14.Fujitsu Easy Kit Cortex M3

15.Fujitsu FM3 Starter Kit

16.Hitex LPC2xxx Motor Control Board

17.Hitex LPC1850 EVB_1

18.Hitex LPC1850 EVB_2

19.Jennic JN5148

20.Keil LPC1768 EVB

21.LPC1114 Xpresso

22.NXP EM773 Demo Board

23.NXP Stepper Motor Board

24.Samsung Cortex M3 EVB

25.Samsung SMLink Debugger

26.Samsung_SMDKV210_Android_2.2

27.Segger J-link Debugger

28.STM Starter Kit Cortex M3


WinMerge

the best tool to merge and diff code on Windows environment

http://winmerge.org/

File Comparison

File Comparison

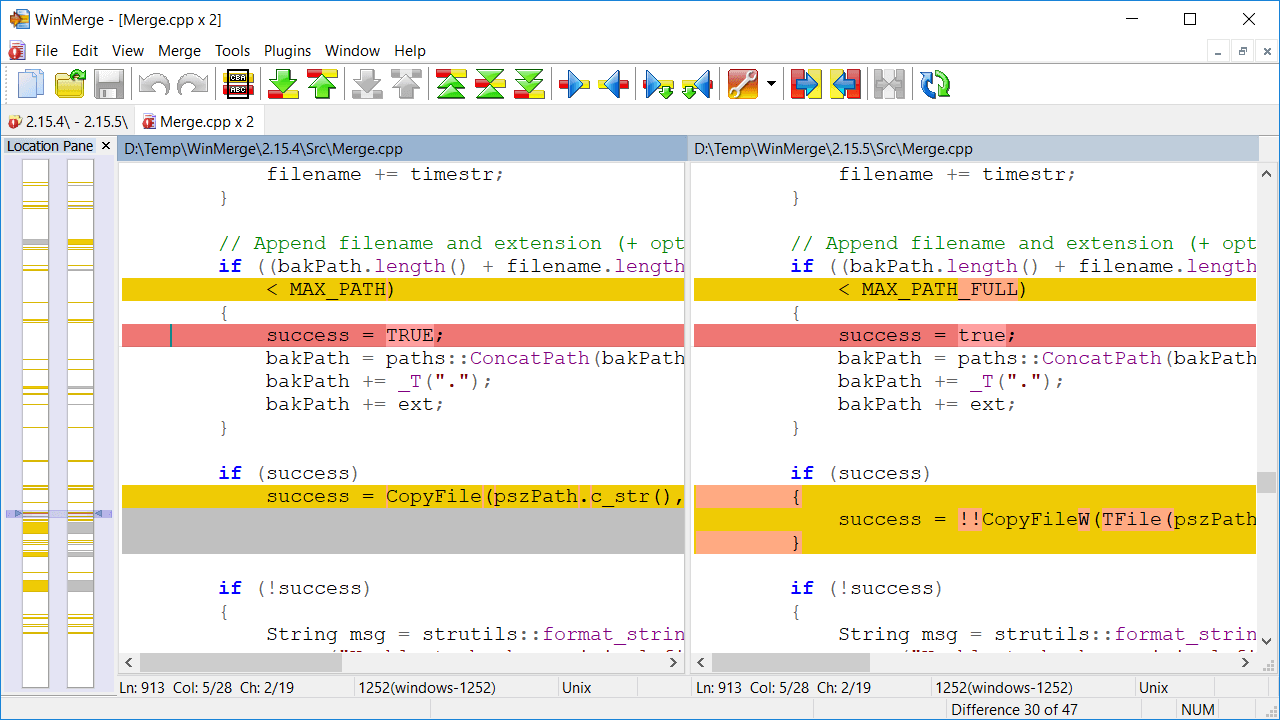
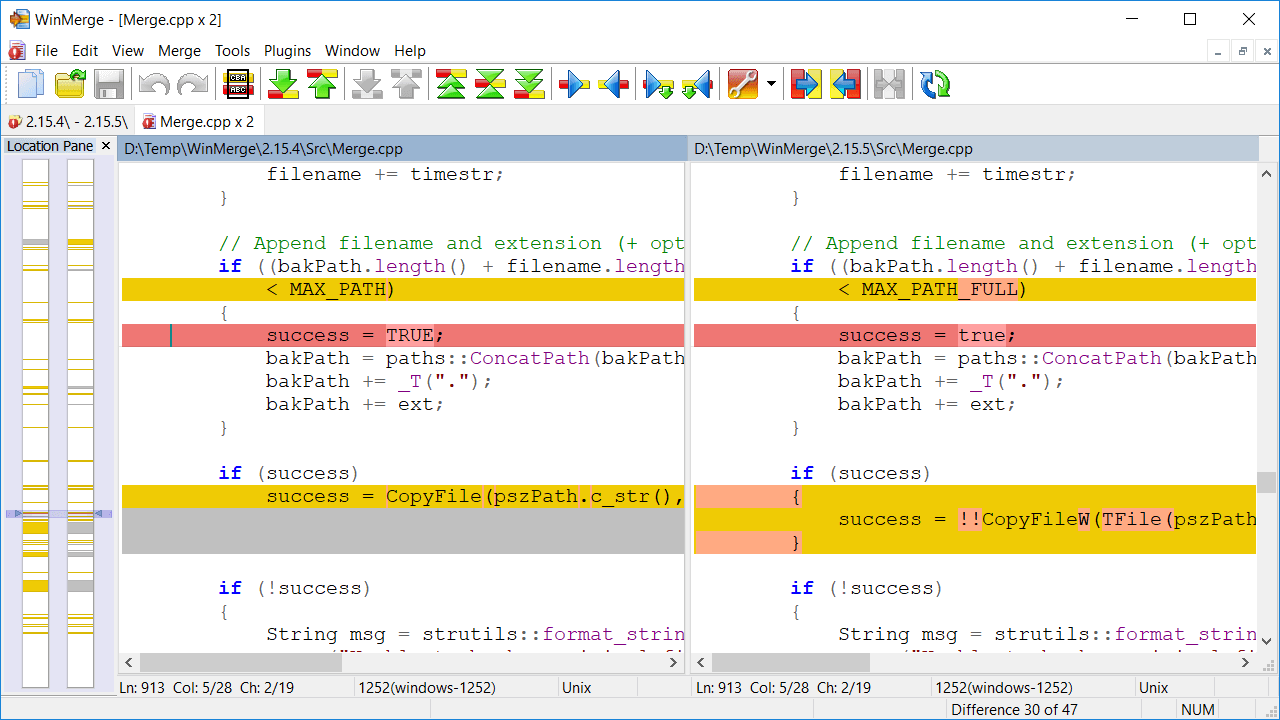
File compare window is basically two files opened to editor into two horizontal panes. Editing allows user to easily do small changes without need to open files to other editor or development environment.

Open-dialog

Open-dialog

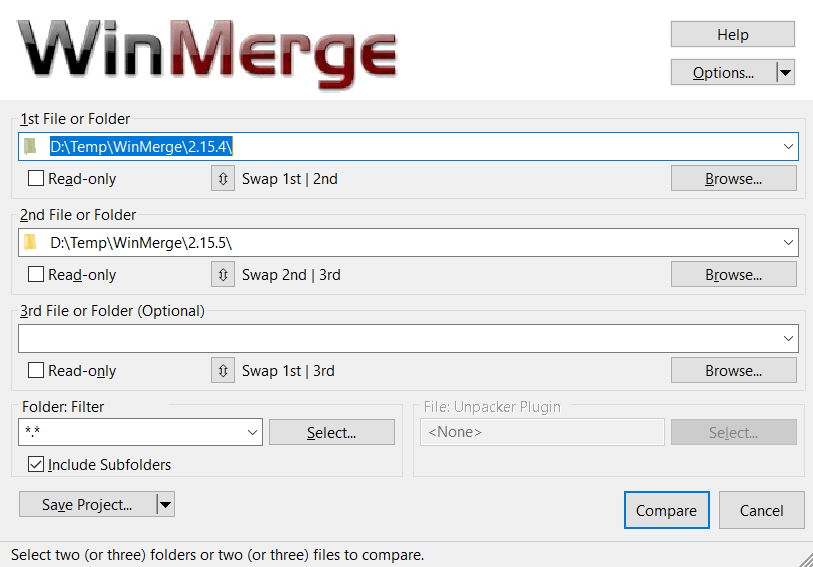
WinMerge allows selecting/opening paths in several ways. Using the Open-dialog is just one of them.

Folder Comparison Results

Folder Comparison Results

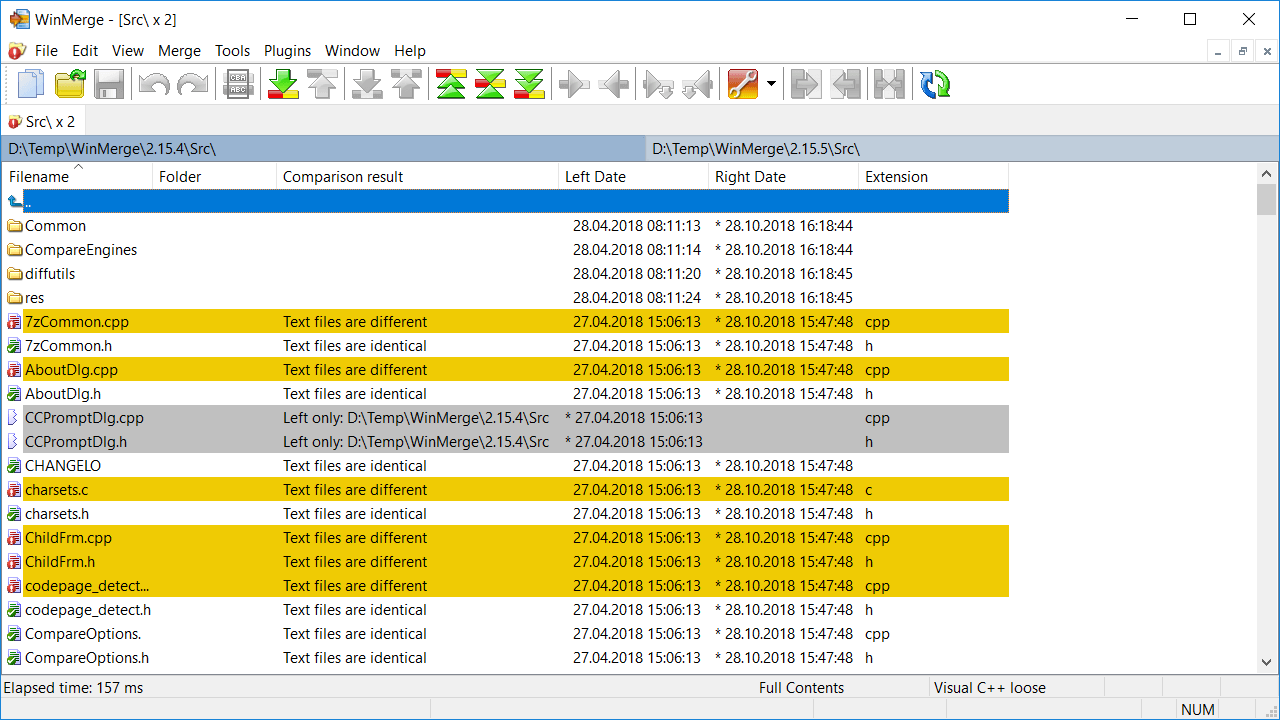
Folder compare shows all files and subfolders found from compared folders as list. Folder compare allows synchronising folders by copying and deleting files and subfolders. Folder compare view can be versatile customised.

Folder Compare Tree View

Folder Compare Tree View

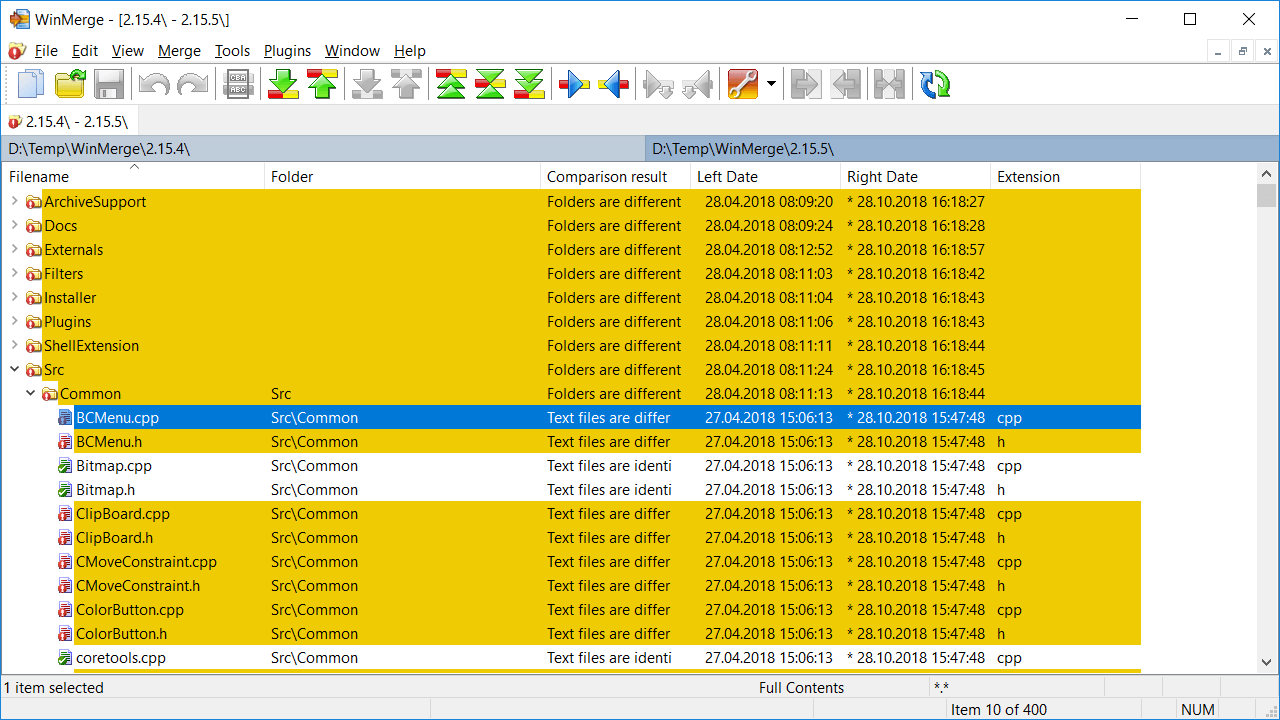
In the tree view, folders are expandable and collapsible, containing files and subfolders. This is useful for an easier navigation in deeply nested directory structures. The tree view is available only in recursive compares.

Highlight Line Diff

Highlight Line Diff

Many times it is useful to see exact differences inside lines. WinMerge can highlight different areas between lines.

Location Pane

Location Pane

Location pane is a handy side-pane showing a overall (difference) map of files compared.

Splash Screen

Splash Screen

WinMerge 2.8 has a new professional looking splash screen.

Đêm Thấy Ta Là Thác Đổ

Đêm Thấy Ta Là Thác Đổ


Một đêm bước chân về gác nhỏ
Chợt nhớ đóa hoa Tường Vi
Bàn tay ngắt hoa từ phố nọ
Giờ đây đã quên vườn xưa

Một hôm bước qua thành phố lạ
Thành phố đã đi ngủ chưa ?
Đời ta có khi tựa lá cỏ
Ngồi hát ca rất tự do

Nhiều khi bỗng như trẻ nhớ nhà
Từ những phố xưa tôi về

Ngày xuân bước chân người rất nhẹ
Mùa xuân đã qua bao giờ
Nhiều đêm thấy ta là thác đổ
Tỉnh ra có khi còn nghe

***
Một hôm bước chân về giữa chợ
Chợt thấy vui như trẻ thơ
Đời ta có khi là đóm lửa
Một hôm nhóm trong vườn khuya

Vườn khuya đóa hoa nào mới nở
Đời tôi có ai vừa qua
Nhiều khi thấy trăm nghìn nấm mộ
Tôi nghĩ quanh đây hồ như

Đời ta hết mang điều mới lạ
Tôi đã sống rất ơ hờ

Lòng tôi có đôi lần khép cửa
Rồi bên vết thương tôi quì
Vì em đã mang lời khấn nhỏ
Bỏ tôi đứng bên đời kia

Android Build: Tips and Tricks

Android Build: Tips and Tricks

All below build steps are trivial, but i took like a week to get a grip of..  just documenting to be handy.

$MYDROID is root of your android source directory.

Quick Incremental Build

Setup the environment for your build setup, go to moudle’s directory with Android.mk and build.
`source $MYDROID/build/envsetup.sh`
`cd ./hardware/ti/omap3/liboverlay`
`mm`

Note: `mm -B` will clean build all the libraries under a subdirectory.

Package build
Building .apk in android SDK. No need of eclipse or PDK.
`source $MYDROID/build/envsetup.sh`
`mmm <path-to-package> `
(say #mmm $MYDROID/packages/gallery)
Selective Clean
`make clean-<modulename>`
(eg. #make clean-libomxcommon )
Complete clean
`make clean`  works but, “rm -rf ./out” is faster

Display full commands

`make showcommands`

Number of parallel threads

This is same as GNU make, and chose it based on number of cpu cores available.
`make -j<number-of-parallel-jobs>`

LPCXpresso Flash/Ram Size and Memory Management

Application Flash / RAM size

As part of the build process, information on the size of your application will normally be displayed at the end of the build log in the Console view. This is done by a post-build step invoking the arm-none-eabi-size utility….


   text    data     bss     dec     hex filename
   2624     524      32    3180     c6c LPCXpresso1768_systick_twinkle.axf

[All numbers are in bytes.]

  • text – shows the code and read-only data in your application (in decimal)
  • data – shows the read-write data in your application (in decimal)
  • bss – show the zero initialized (‘bss’ and ‘common’) data in your application (in decimal)
  • dec – total of ‘text’ + ‘data’ + ‘bss’ (in decimal)
  • hex – hexidecimal equivalent of ‘dec’

Typically,

  • the flash consumption of your application will then be text + data
  • the RAM consumption of your application will then be data + bss.

Remember that the RAM consumption provided by this is only that of your global data. It will not include any memory consumed by your stack and heap when your application is actually executing.

You can also manually run the arm-none-eabi-size utility on both your final application image, or on individual object files.

To view the size of the image, right click over the .axf file in the Debug or Release subdirectory of your application project and select the Binary Utilities -> Size option. To view the size of an individual object file, select the appropriate .o file in the Debug\src or Release\src subdirectory of the project and again select the Binary Utilities -> Size option.


Linker map files

The linker option “-Map” option, which is enabled by default by the project wizard when a new project is created, allows you to analyse in more detail the contents of your application image. When you do a build, this will cause a file called <application>.map to be created in the Debug (or Release) subdirectory, which can be loaded into the editor view.

This contains a large amount of information, including:

  • A list of archive members (library objects) included and why
  • A list of discarded input sections (because they are unused and the linker option --gc-sections is enabled).
  • The location, size and type of all code, data and bss items that have been placed in the image.

Stack problems

There is no stack checking on the Cortex-M families, so you have to be careful where you place the stack, program data, and the heap (e.g. malloc() space).

If you are using the standard (provided) linker scripts, the stack is placed at the top of RAM, program data is at the bottom on RAM, and the heap immediately after that.

If you are using a lot of stack, it can grow into the heap or even the program data space. If the stack has ‘overflowed’ into those spaces, when you write to the heap/program data it can overwrite values on the stack and thus corrupt it.

The stack is used for both your application AND any interrupts that may be firing (including nested interrupt), so you need to ensure there is enough space for the worst-case scenario.

Also, check that you are not allocating large amounts of data on the stack (e.g. allocating a local array, as this will be placed on the stack).


Heap allocation/checking

By default, the heap used by Redlib_v2’s malloc family of routines grows upwards from the end of the user data in RAM up towards the stack (a “one region memory model”).

When a new block of memory is requested, the memory allocation code will make a call to the following function:

unsigned __check_heap_overflow (void * new_end_of_heap)

The default version of this function compares the value of the proposed new end of the heap against the stack pointer and will return one of the following values…

  • 1 – Heap will overflow into stack
    0 – Heap still OK

If 1 is returned, malloc will set errno to ENOMEM and return a null pointer to the caller

It is possible for the user to modify heap setup such that the heap is placed in different region of memory to the stack (a “two region memory model”). To do this, the user will need to…

  1. Modify the setting of the “_pvHeapStart” variable created within the managed linker script, which is used to mark the starting location for the heap.
  2. Provide their own implementation of __check_heap_overflow(), to replace the one pulled in from the Redlib nohost/semihost library variant.

Note that Redlib_v2 uses the variable “__end_of_heap” to keep track of the end of the heap. Be aware though that this does not necessarily detail the maximum extent of the heap, only its current extent.


Ref: http://support.code-red-tech.com/

Cross compiler naming convention

I have tried to understand the naming conventions behind the gcc cross-compilers, .For example, I have the following three cross-compilers in my system:

  • arm-none-linux-gnueabi (CodeSourcery ARM compiler for linux)
  • arm-none-eabi (CodeSourcery ARM compiler for bare-metal systems)
  • arm-eabi (Android ARM compiler)

The naming comes down to this:

arch-vendor-(os-)abi

arm-none-linux-gnueabi = ARM architecture, no vendor, linux OS, and the gnueabi ABI.

arm-none-eabi = ARM architecture, no vendor, none OS, eabi

The arm-eabi is  used for Android native apps

EABI : embedded Application Binary Interface

GNU EABI is a new application binary interface (ABI) for Linux. It is part of a new family of ABI’s from ARM® Ltd. known in the arm-linux community as EABI (or sometimes Embedded ABI).

Demystifying the volatile keyword

Following on from my earlier post about the restrict keyword, I’d like to try and dispell the myth around the volatile keyword. The meaning of volatile is a popular interview question, particularly for embedded development jobs and I’ve heard some programmers describe the properties of this keyword as if it had super powers.

The volatile keyword does a very simple job. When a variable is marked as volatile, the programmer is instructing the compiler not to cache this variable in a register but instead to read the value of the variable from memory each and every time the variable is used. That’s it – simple isn’t it?

To illustrate the use of the keyword, consider the following example:

1
2
3
volatile int* vp = SOME_REGISTER_ADDRESS;
for(int i=0; i<100; i++)
    foo(*vp);

In this simple example, the pointer vp points to a volatile int. The value of this int is read from memory for each loop iteration. If volatile was not specified then it is likely that the compiler would generate optimized code which would read the value of the int once, temporarily store this in a register and then use the register copy during each iteration.

Examples of where volatile is often used:

  • When accessing hardware registers via pointers. It is necessary for the generated code to always access the hardware registers value and never a potentially out of date copy.
  • When accessing a variable that is shared between two or more threads or between a thread and an ISR.

Common myths about the volatile keyword:

  • A volatile variable will never reside in cache memory – e.g. within the L2 cache of a processor. This is not true. In the case where the volatile variable is shared between two software threads, it is highly likely that the variable will exist in cached memory and the cache coherency policy will ensure that the threads will see the correct and up-to-date value of the variable in the event that the threads are running on seperate cores that don’t share the same cache. When the volatile variable refers to a hardware register, it is likely that the memory map of the system will be setup such that this register is not cacheable in the processor cache, but this is setup and managed by the appropriate device driver and is not something that is provided by the volatile keyword.

Thats’ it. So the next time you hear somebody waxing lyrical about the super powers of the volatile keyword, please feel empowered to enlighten them!

Ref: http://softwareramblings.com/2008/05/demystifying-the-volatile-keyword.html

How does Linux Kernel know where to look for driver firmware ?


From the kernel’s perspective, see /usr/src/linux/Documentation/firmware_class/README:

 kernel(driver): calls request_firmware(&fw_entry, $FIRMWARE, device)

 userspace:
        - /sys/class/firmware/xxx/{loading,data} appear.
        - hotplug gets called with a firmware identifier in $FIRMWARE
          and the usual hotplug environment.
                - hotplug: echo 1 > /sys/class/firmware/xxx/loading

 kernel: Discard any previous partial load.

 userspace:
                - hotplug: cat appropriate_firmware_image > \
                                        /sys/class/firmware/xxx/data

 kernel: grows a buffer in PAGE_SIZE increments to hold the image as it
         comes in.

 userspace:
                - hotplug: echo 0 > /sys/class/firmware/xxx/loading

 kernel: request_firmware() returns and the driver has the firmware
         image in fw_entry->{data,size}. If something went wrong
         request_firmware() returns non-zero and fw_entry is set to
         NULL.

 kernel(driver): Driver code calls release_firmware(fw_entry) releasing
                 the firmware image and any related resource.

The kernel doesn’t actually load any firmware at all. It simply informs userspace, “I want a firmware by the name of xxx“, and waits for userspace to pipe the firmware image back to the kernel.

Now, on Ubuntu 8.04,

$ grep firmware /etc/udev/rules.d/80-program.rules
# Load firmware on demand
SUBSYSTEM=="firmware", ACTION=="add", RUN+="firmware_helper"

so as you’ve discovered, udev is configured to run firmware_helper when the kernel asks for firmware.

$ apt-get source udev
Reading package lists... Done
Building dependency tree
Reading state information... Done
Need to get 312kB of source archives.
Get:1 http://us.archive.ubuntu.com hardy-security/main udev 117-8ubuntu0.2 (dsc) [716B]
Get:2 http://us.archive.ubuntu.com hardy-security/main udev 117-8ubuntu0.2 (tar) [245kB]
Get:3 http://us.archive.ubuntu.com hardy-security/main udev 117-8ubuntu0.2 (diff) [65.7kB]
Fetched 312kB in 1s (223kB/s)
gpg: Signature made Tue 14 Apr 2009 05:31:34 PM EDT using DSA key ID 17063E6D
gpg: Can't check signature: public key not found
dpkg-source: extracting udev in udev-117
dpkg-source: unpacking udev_117.orig.tar.gz
dpkg-source: applying ./udev_117-8ubuntu0.2.diff.gz
$ cd udev-117/
$ cat debian/patches/80-extras-firmware.patch

If you read the source, you’ll find that Ubuntu wrote a firmware_helper which is hard-coded to first look for /lib/modules/$(uname -r)/$FIRMWARE, then /lib/modules/$FIRMWARE, and no other locations. Translating it to sh, it does approximately this:

echo -n 1 > /sys/$DEVPATH/loading cat /lib/firmware/$(uname -r)/$FIRMWARE > /sys/$DEVPATH/data \ || cat /lib/firmware/$FIRMWARE > /sys/$DEVPATH/data if [ $? = 0 ]; then echo -n 1 > /sys/$DEVPATH/loading echo -n -1 > /sys/$DEVPATH/loading fi 

which is exactly the format the kernel expects.


To make a long story short: Ubuntu’s udev package has customizations that always look in /lib/firmware/$(uname -r) first. This policy is being handled in userspace.

Ref link: http://stackoverflow.com/questions/950107/how-does-linux-kernel-know-where-to-look-for-driver-firmware

Install LTIB on Ubuntu 10.10

Install LTIB on Ubuntu 10.10

–          Pre-Install  dependency package

$sudo apt-get install cvs g++ rpm libncurses5-dev bison m4 patch zlib1g-dev

Download LTIB

$ cvs -z3 -d:pserver:anonymous@cvs.savannah.nongnu.org:/sources/ltib co -P ltib

–          $ cd ltib

–          Add sudo permission for excute rpm

To configure this, as root using the command “/usr/sbin/visudo”,

$sudo  /usr/sbin/visudo

and add the following line in the User privilege section:

tung ALL = NOPASSWD: /usr/bin/rpm, /opt/ltib/usr/bin/rpm

<Ctrl-O to save , Ctrl-X to exit>


Installing host support packages.

tung@owl:~/project/ltib$ ./ltib –hostcf

This only needs to be done once per host, but may take up to
an hour to complete …

If an error occurs, a log file with the full output may be found in:
/home/tung/project/ltib/host_config.log

–          Build LTIB
./ltib

–          If you would like to see the log messages as the host packages are built and installed:

* Open another terminal in the same directory

* Run the command: tail -f host_config.log

* When you’re done with the tail, use CTRL+C to exit

Design a site like this with WordPress.com
Get started